 Rosetta
Reports & Charts
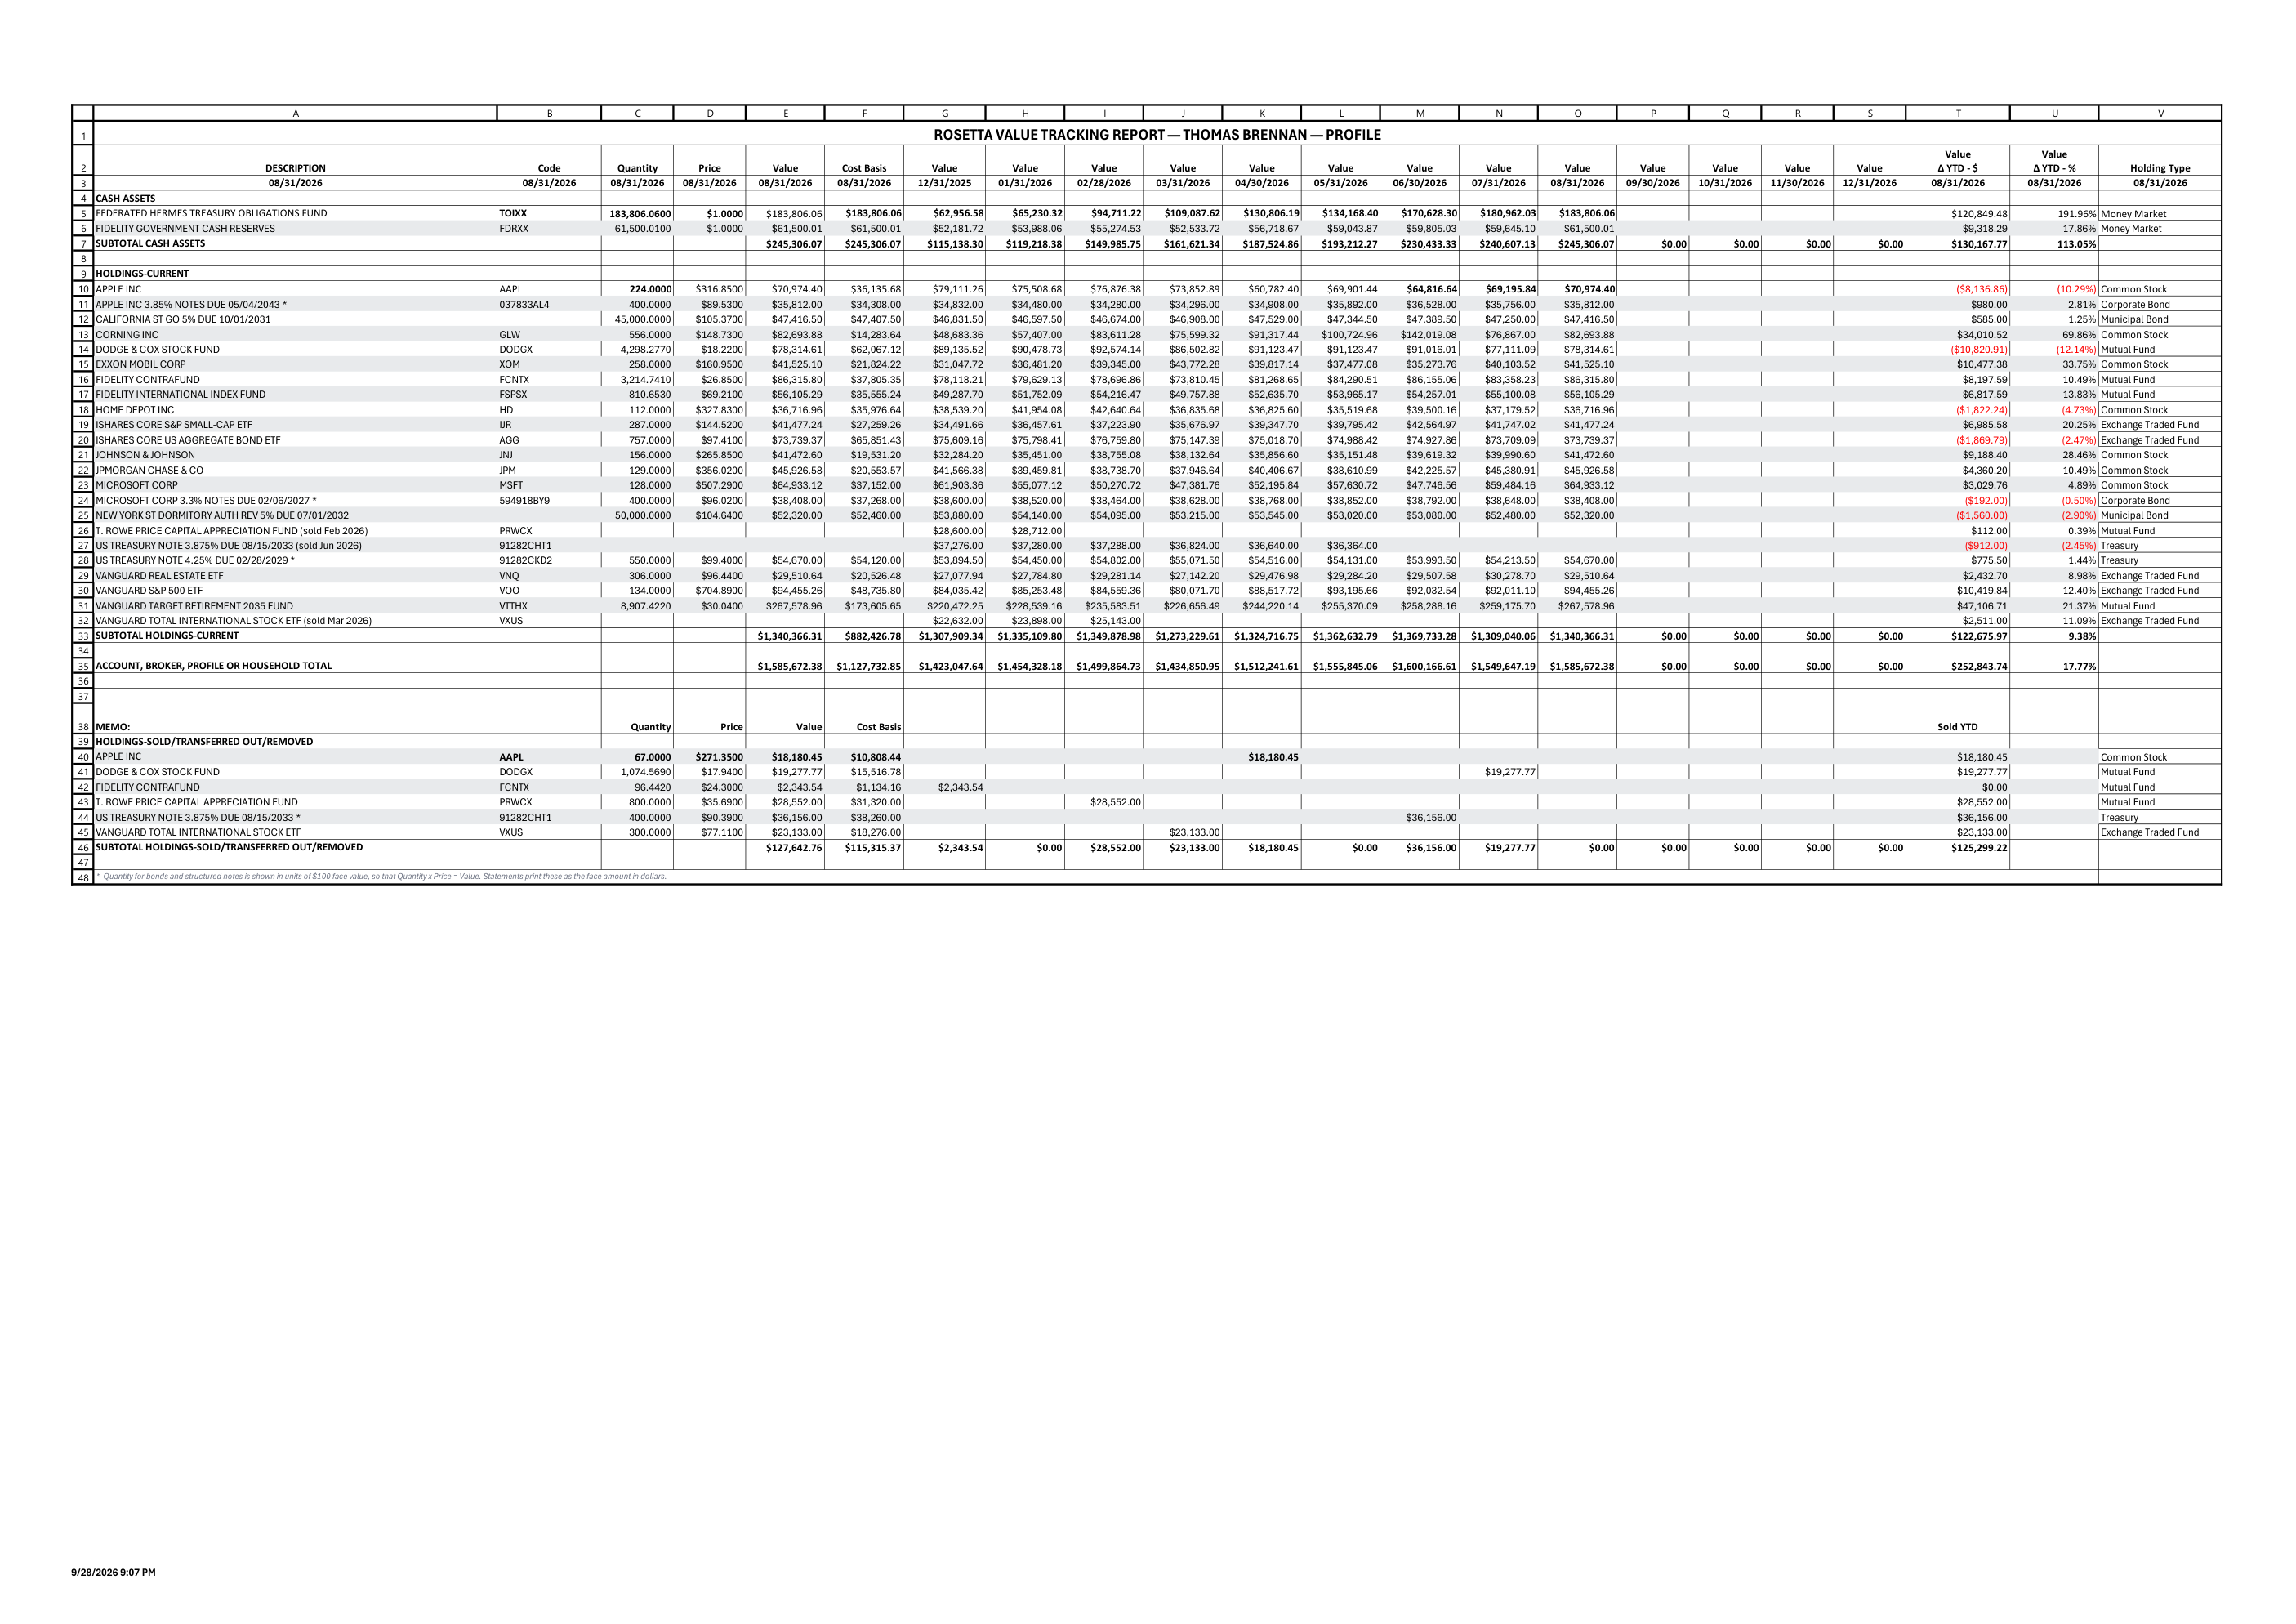
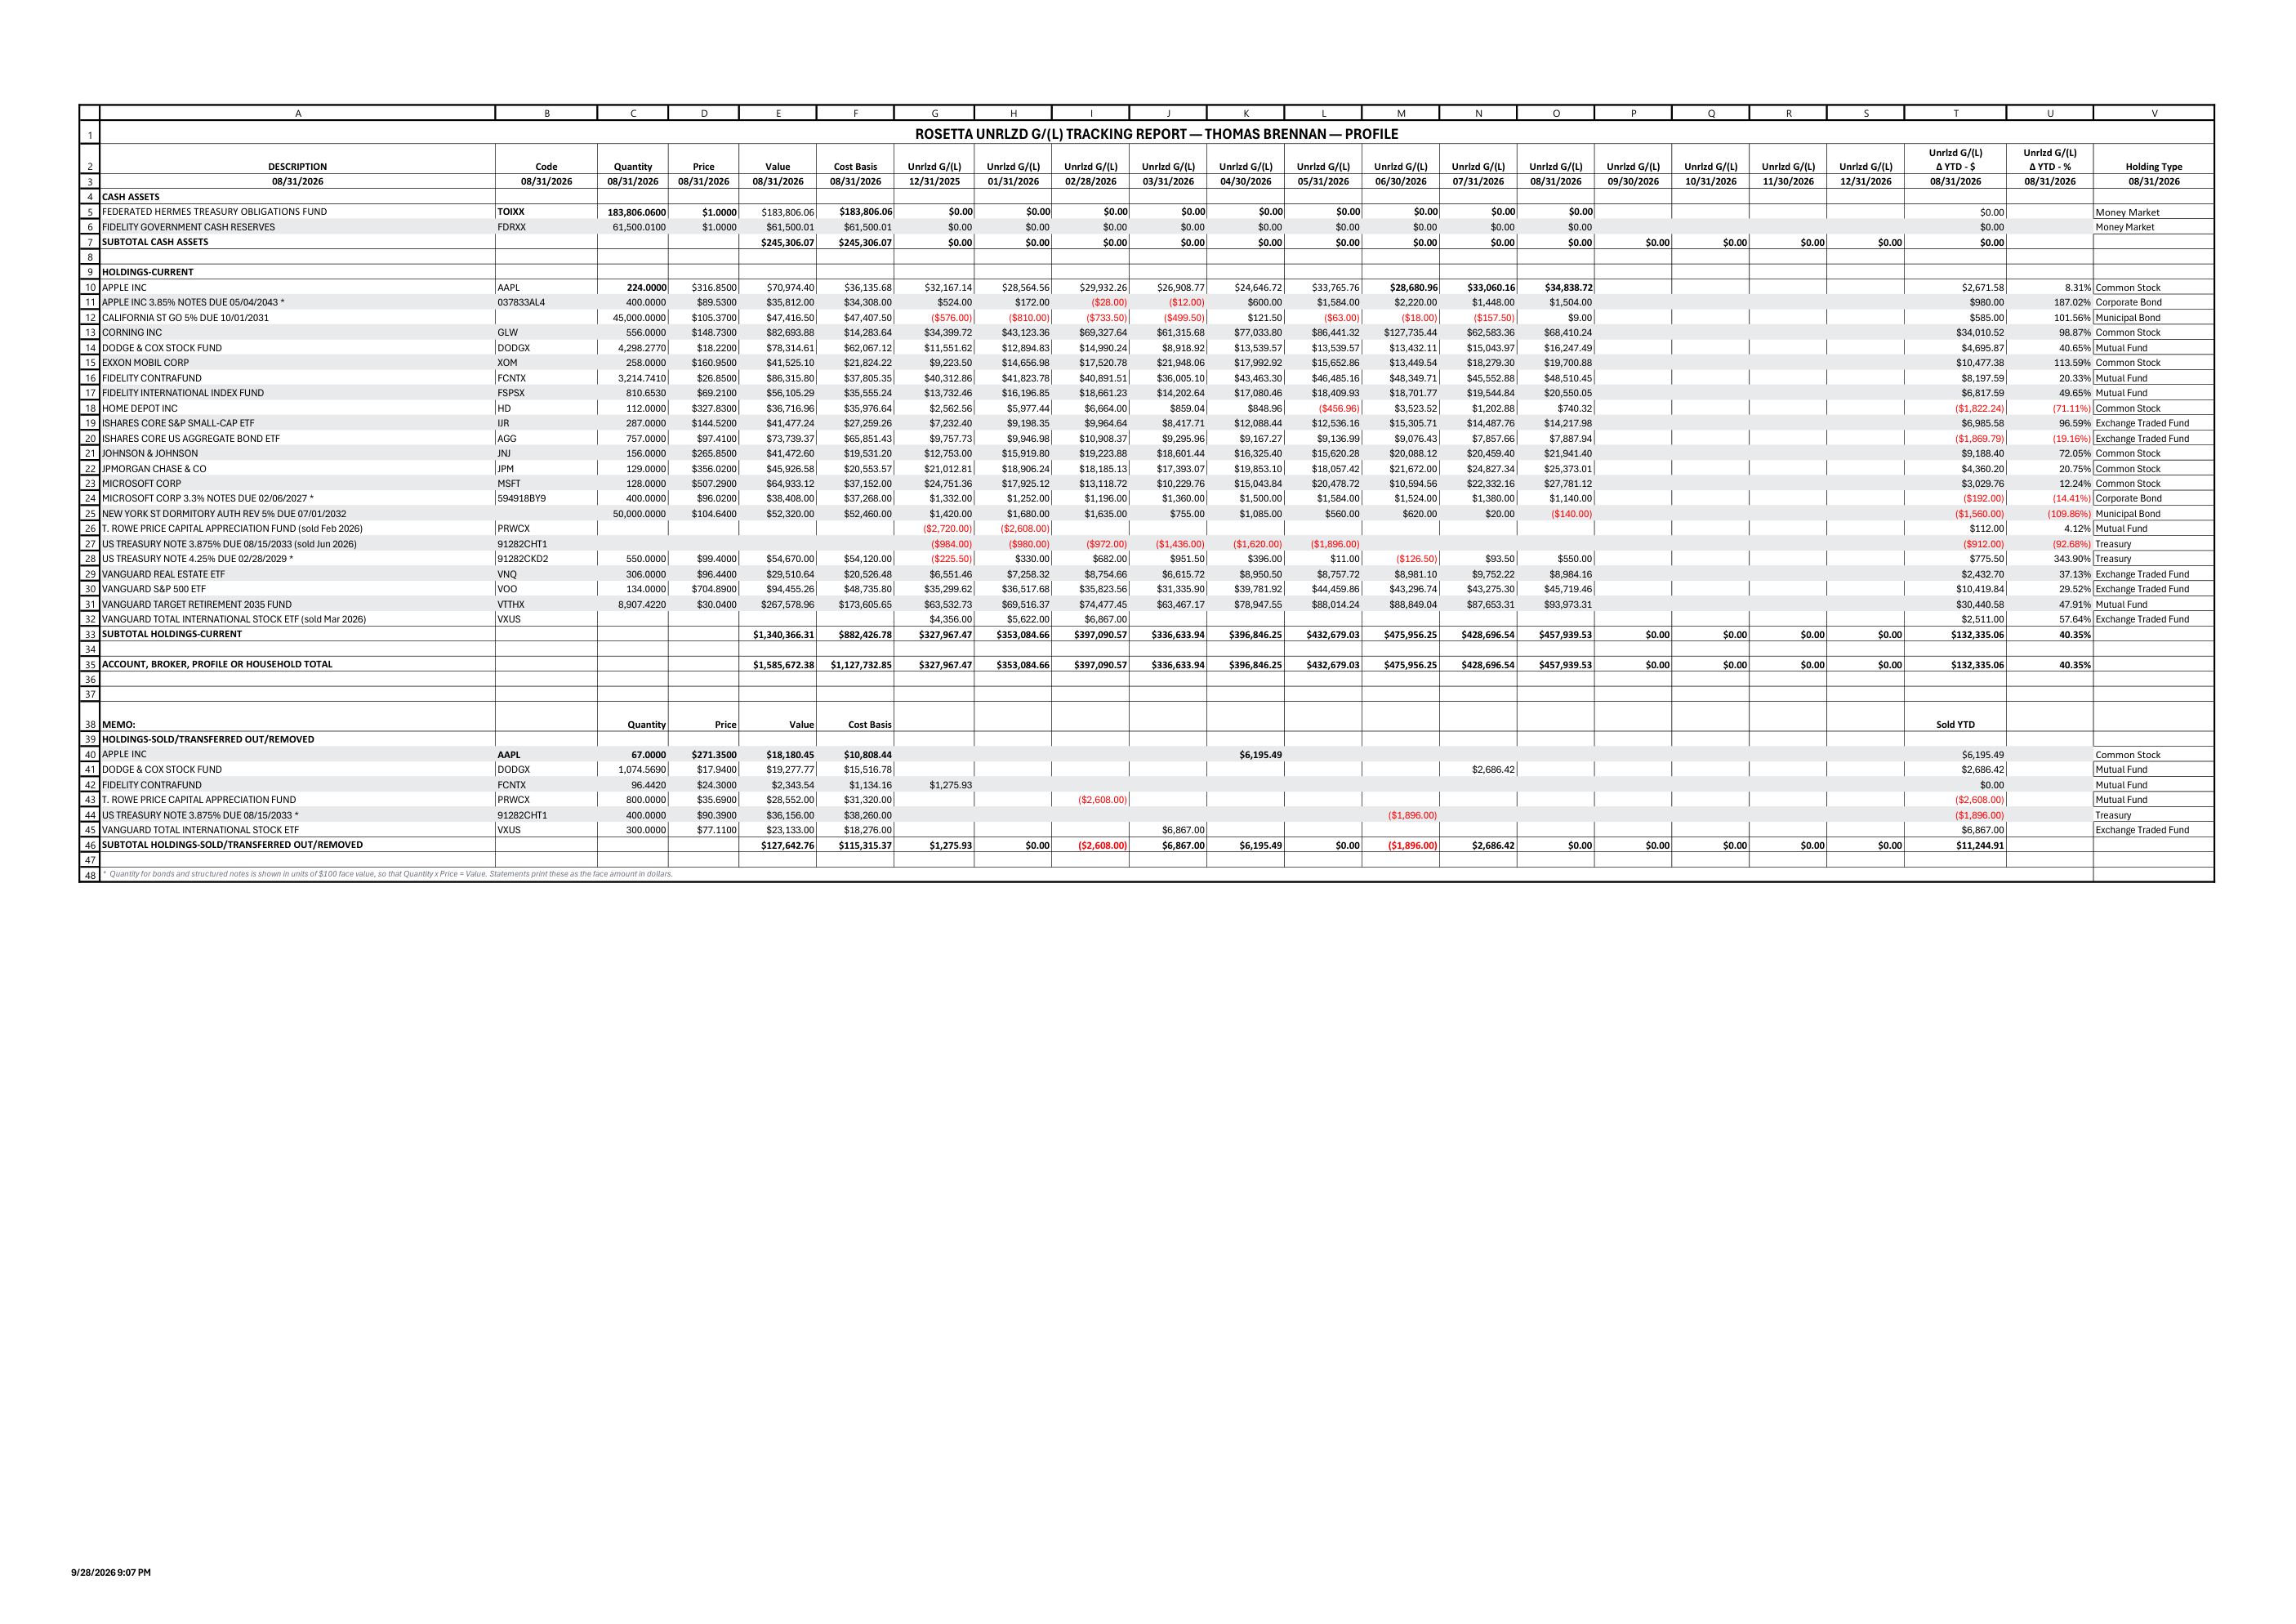
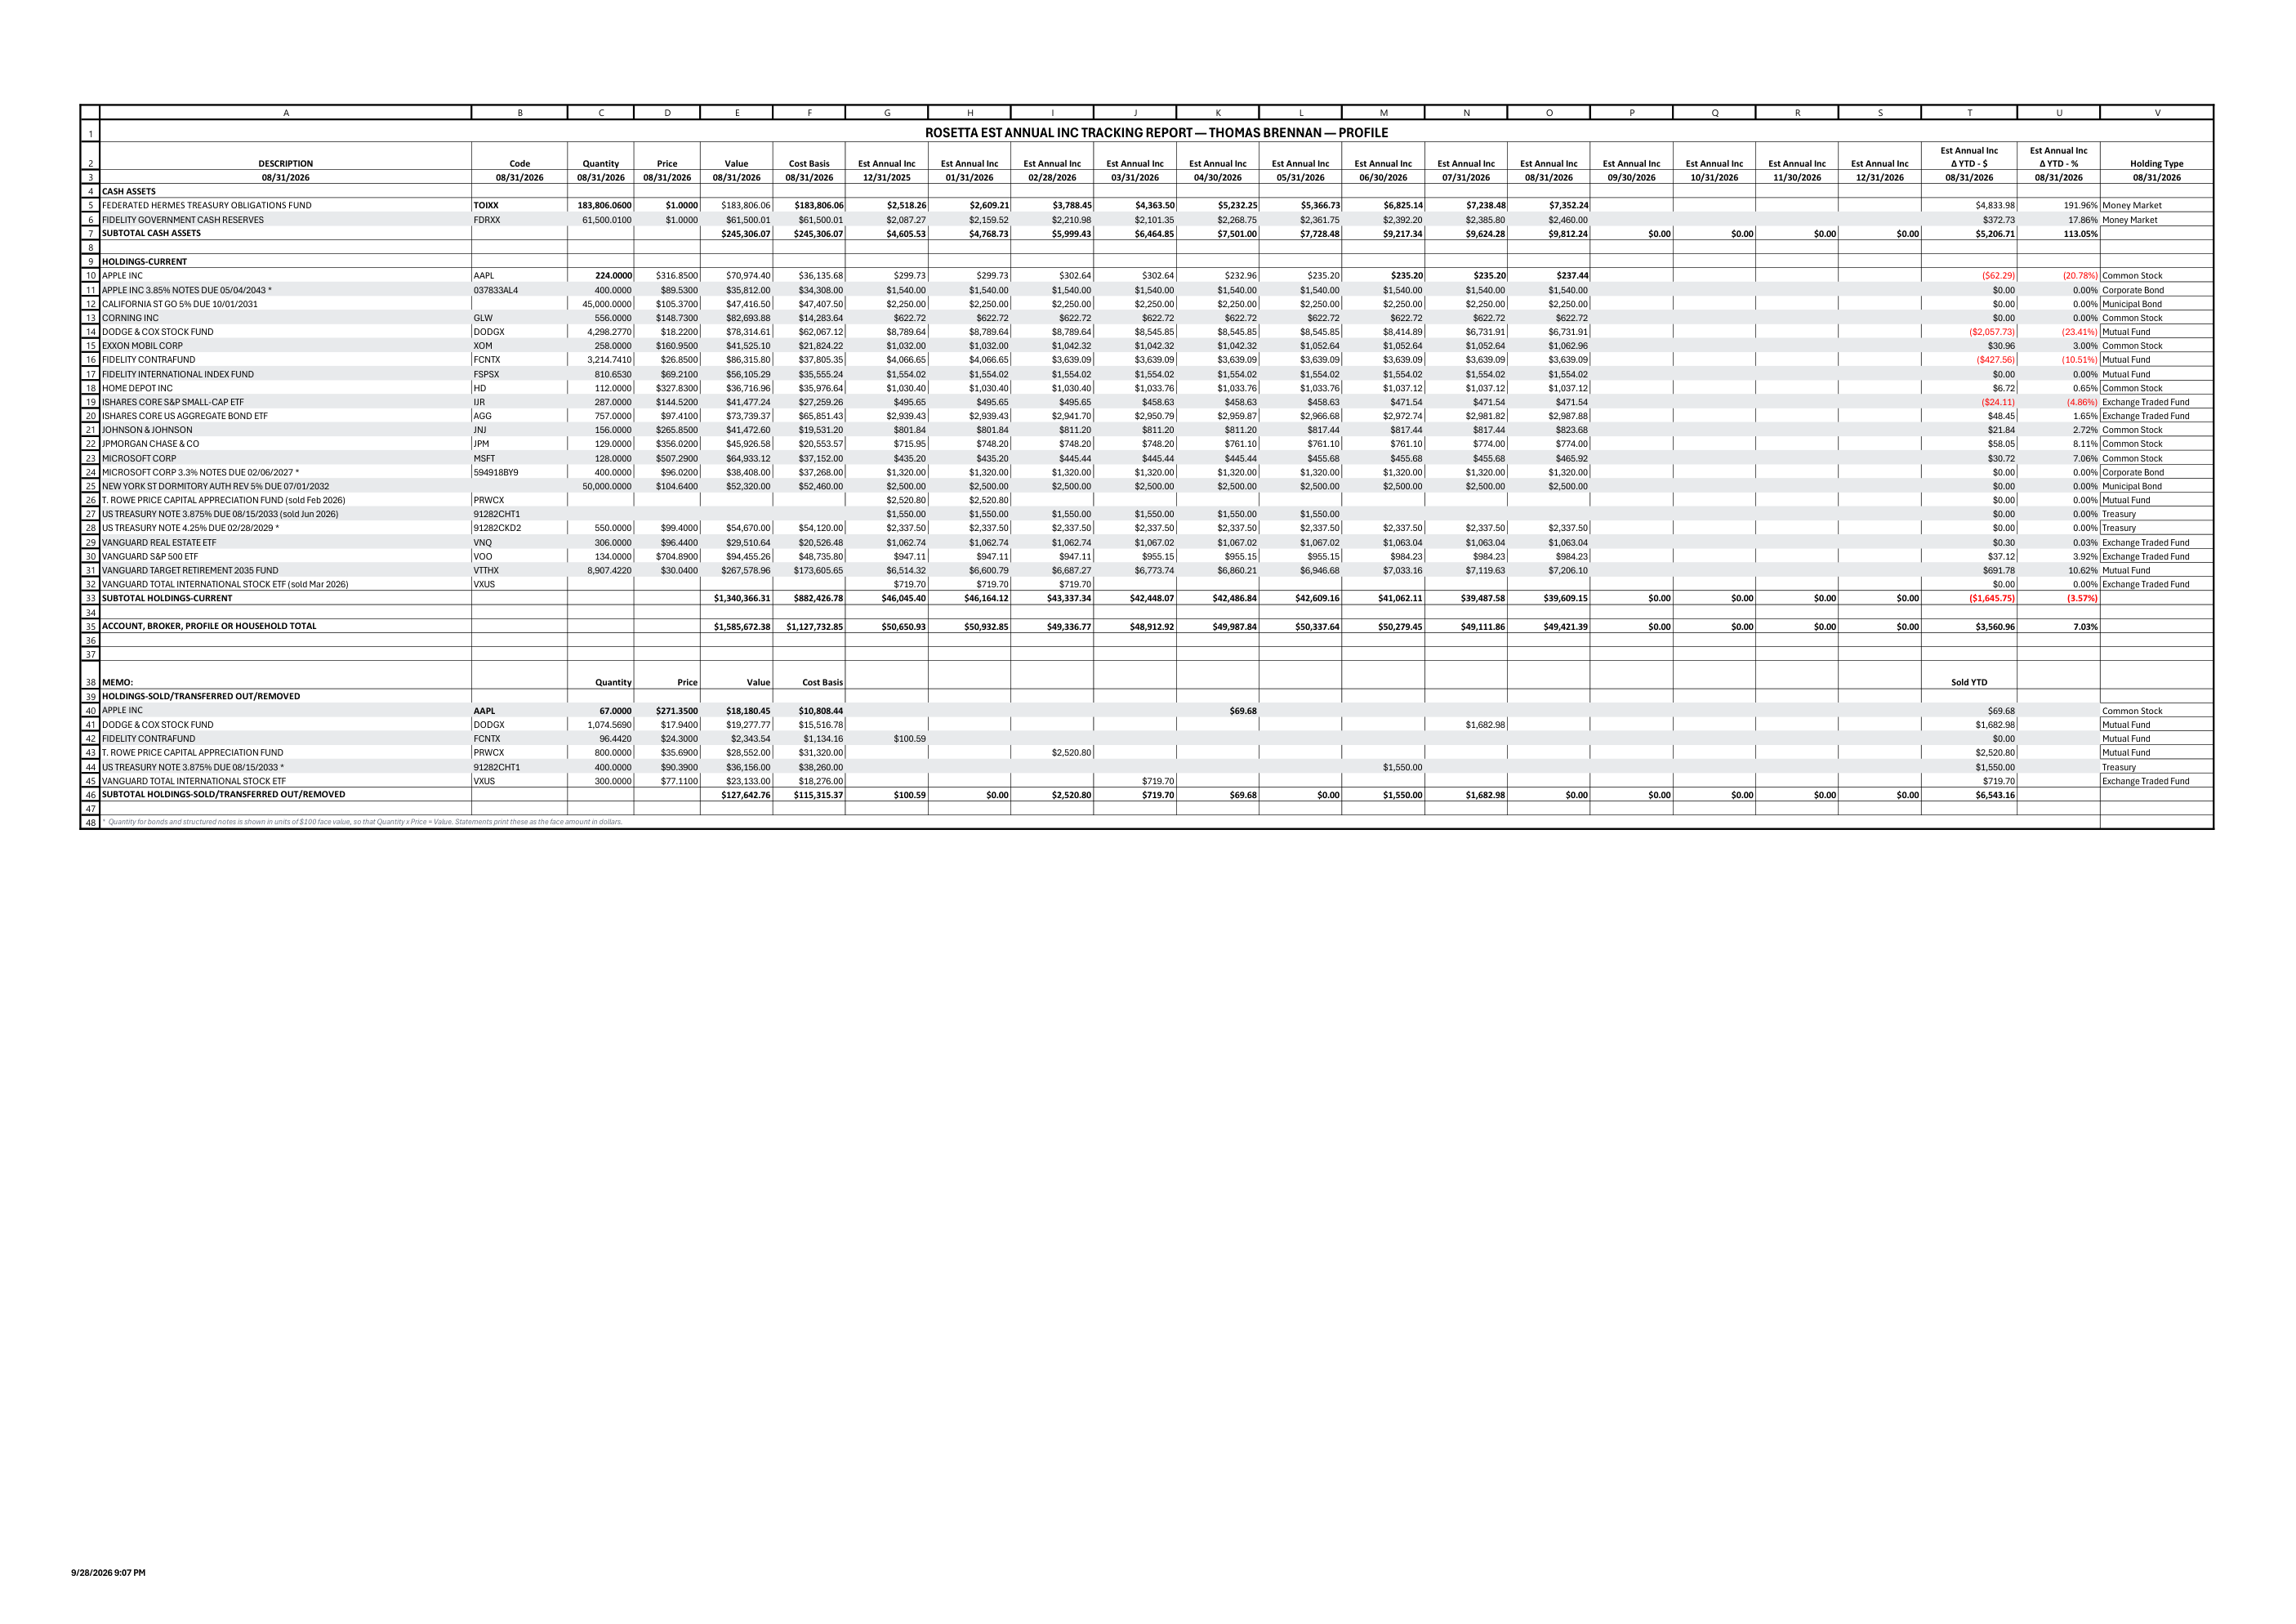
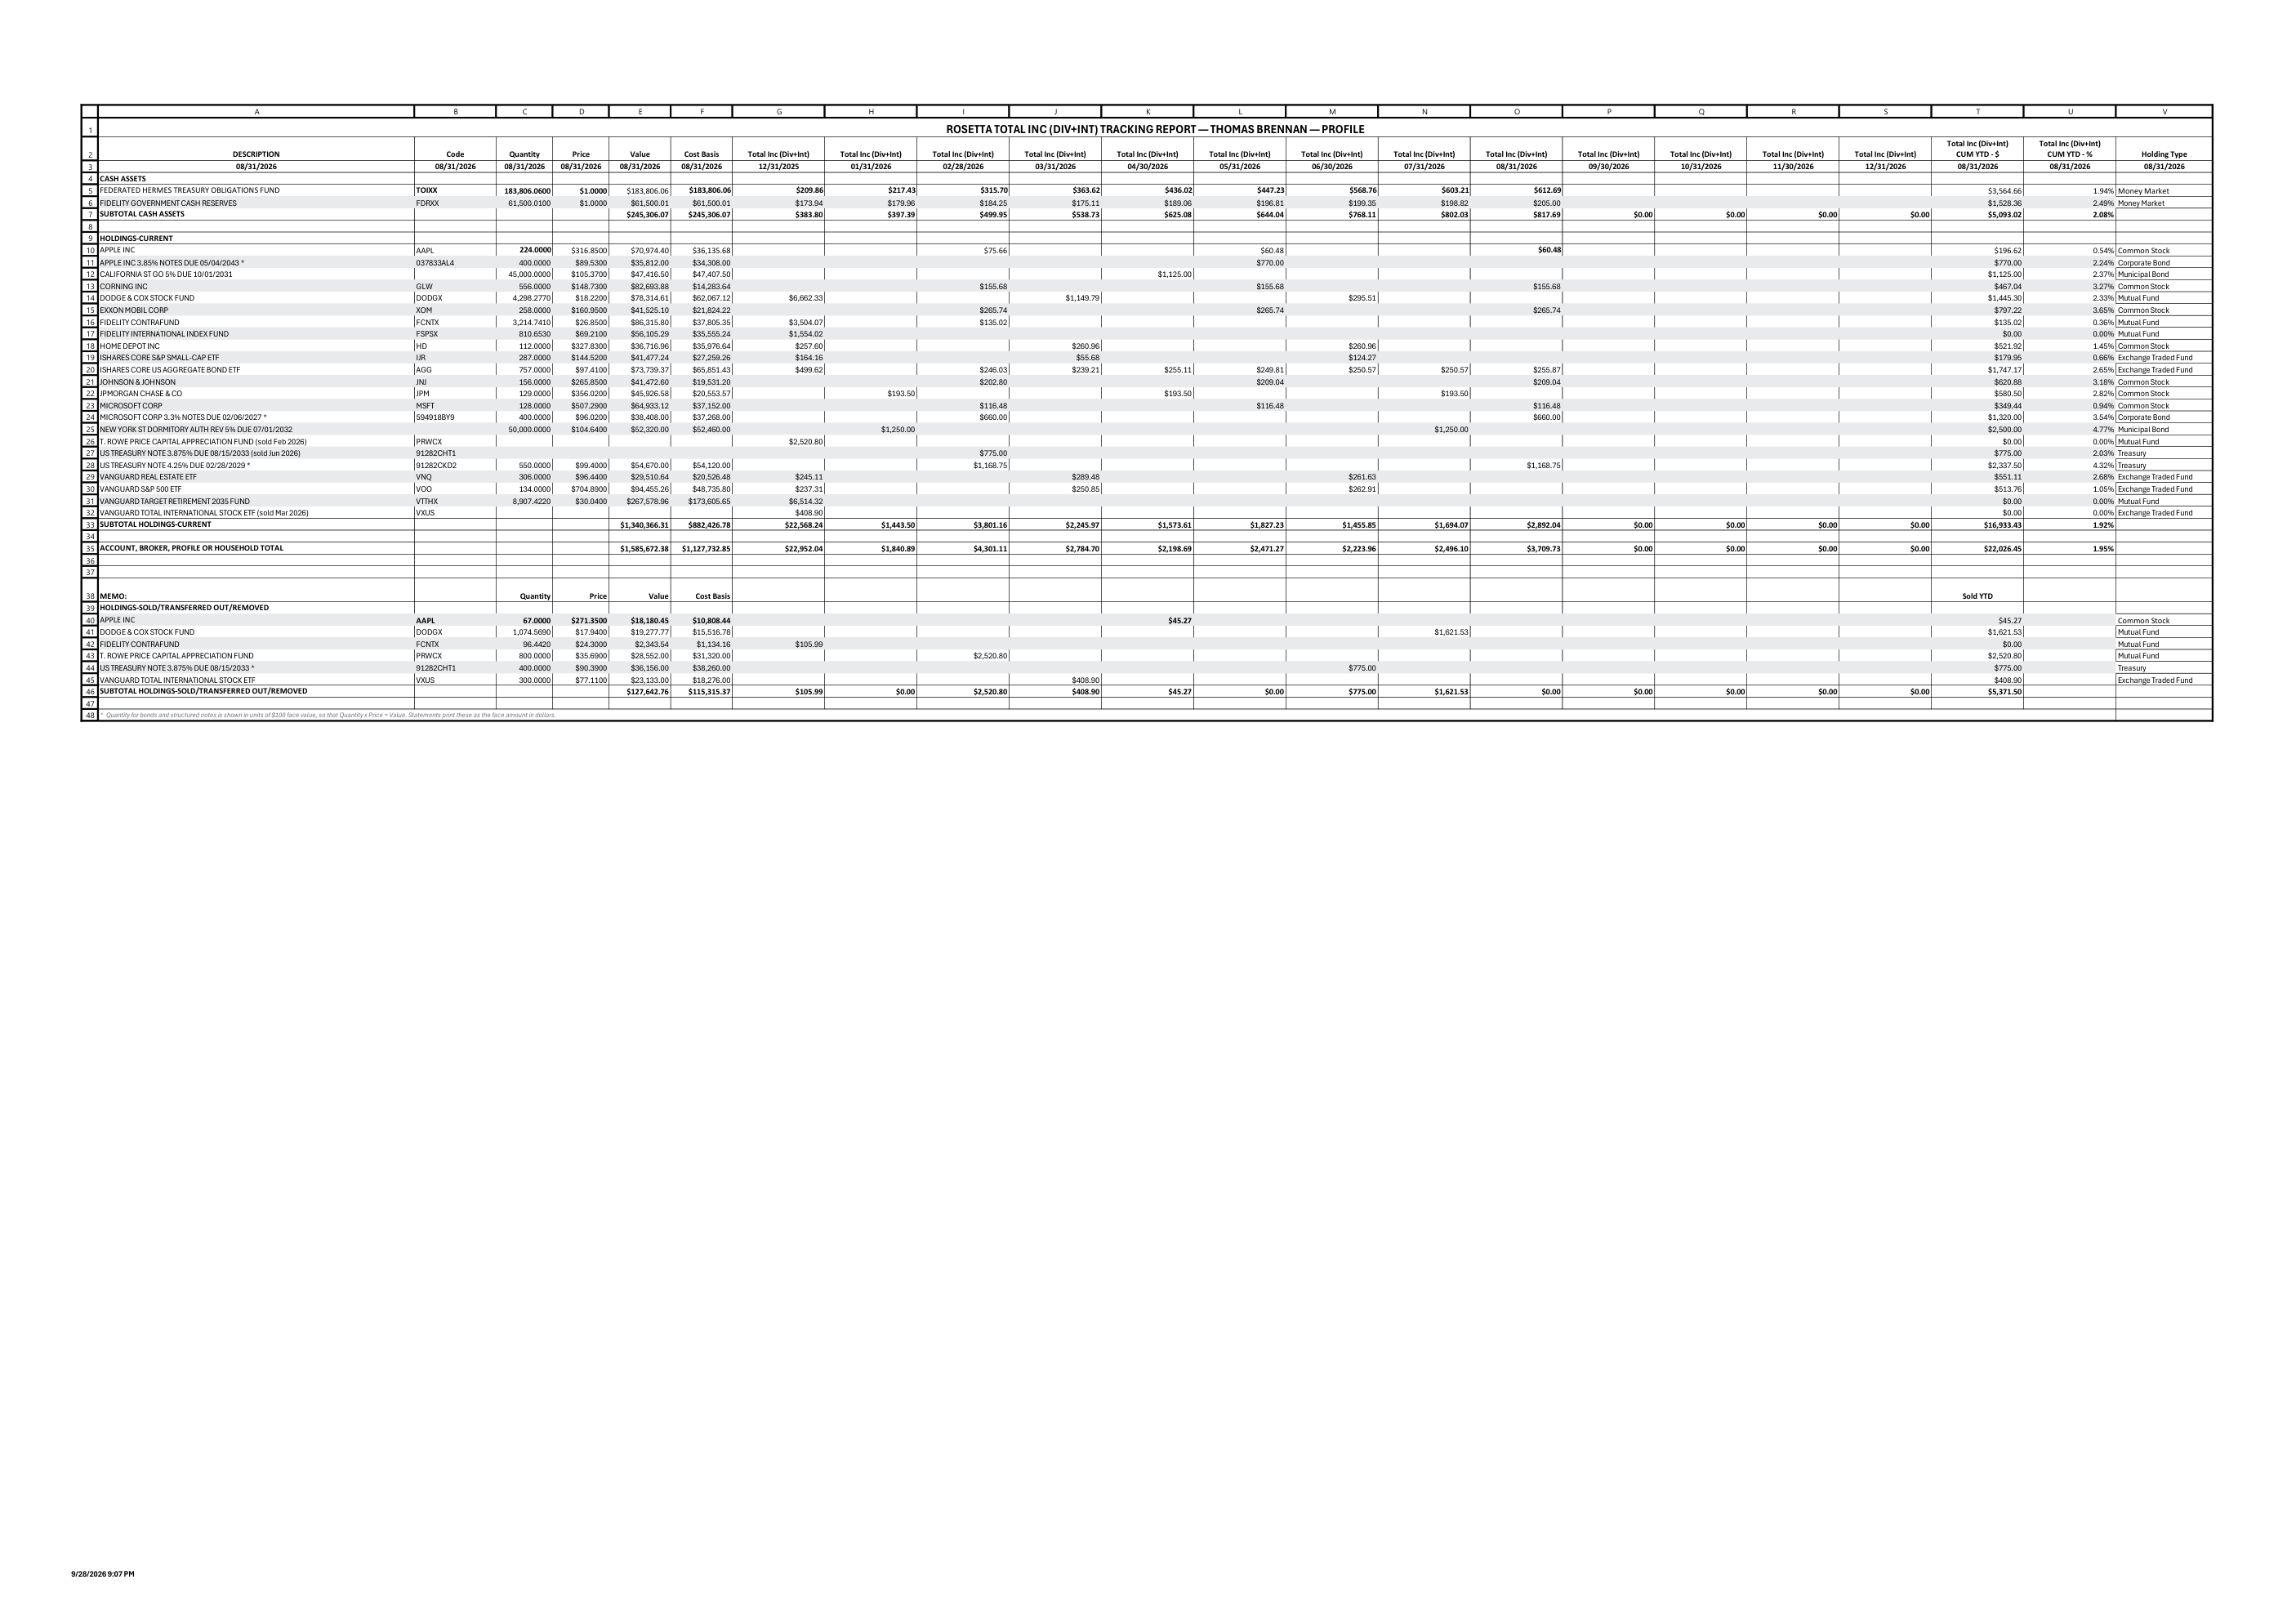
Every report reconciles to the statements it came from, to the penny, before it is produced; every chart is drawn from the same reconciled figures. The 6 trendline reports and 12 charts below were produced by RosettaFi from a sample household — invented accounts, invented figures, real market prices.
Total Value
 Click to see full size
SAMPLE DATA — NOT A REAL PORTFOLIO
Unrealized Gain/(Loss)
 Click to see full size
SAMPLE DATA — NOT A REAL PORTFOLIO
Estimated Annual Income
 Click to see full size
SAMPLE DATA — NOT A REAL PORTFOLIO
Total Income (Dividends + Interest)
 Click to see full size
SAMPLE DATA — NOT A REAL PORTFOLIO
Advisory Fees
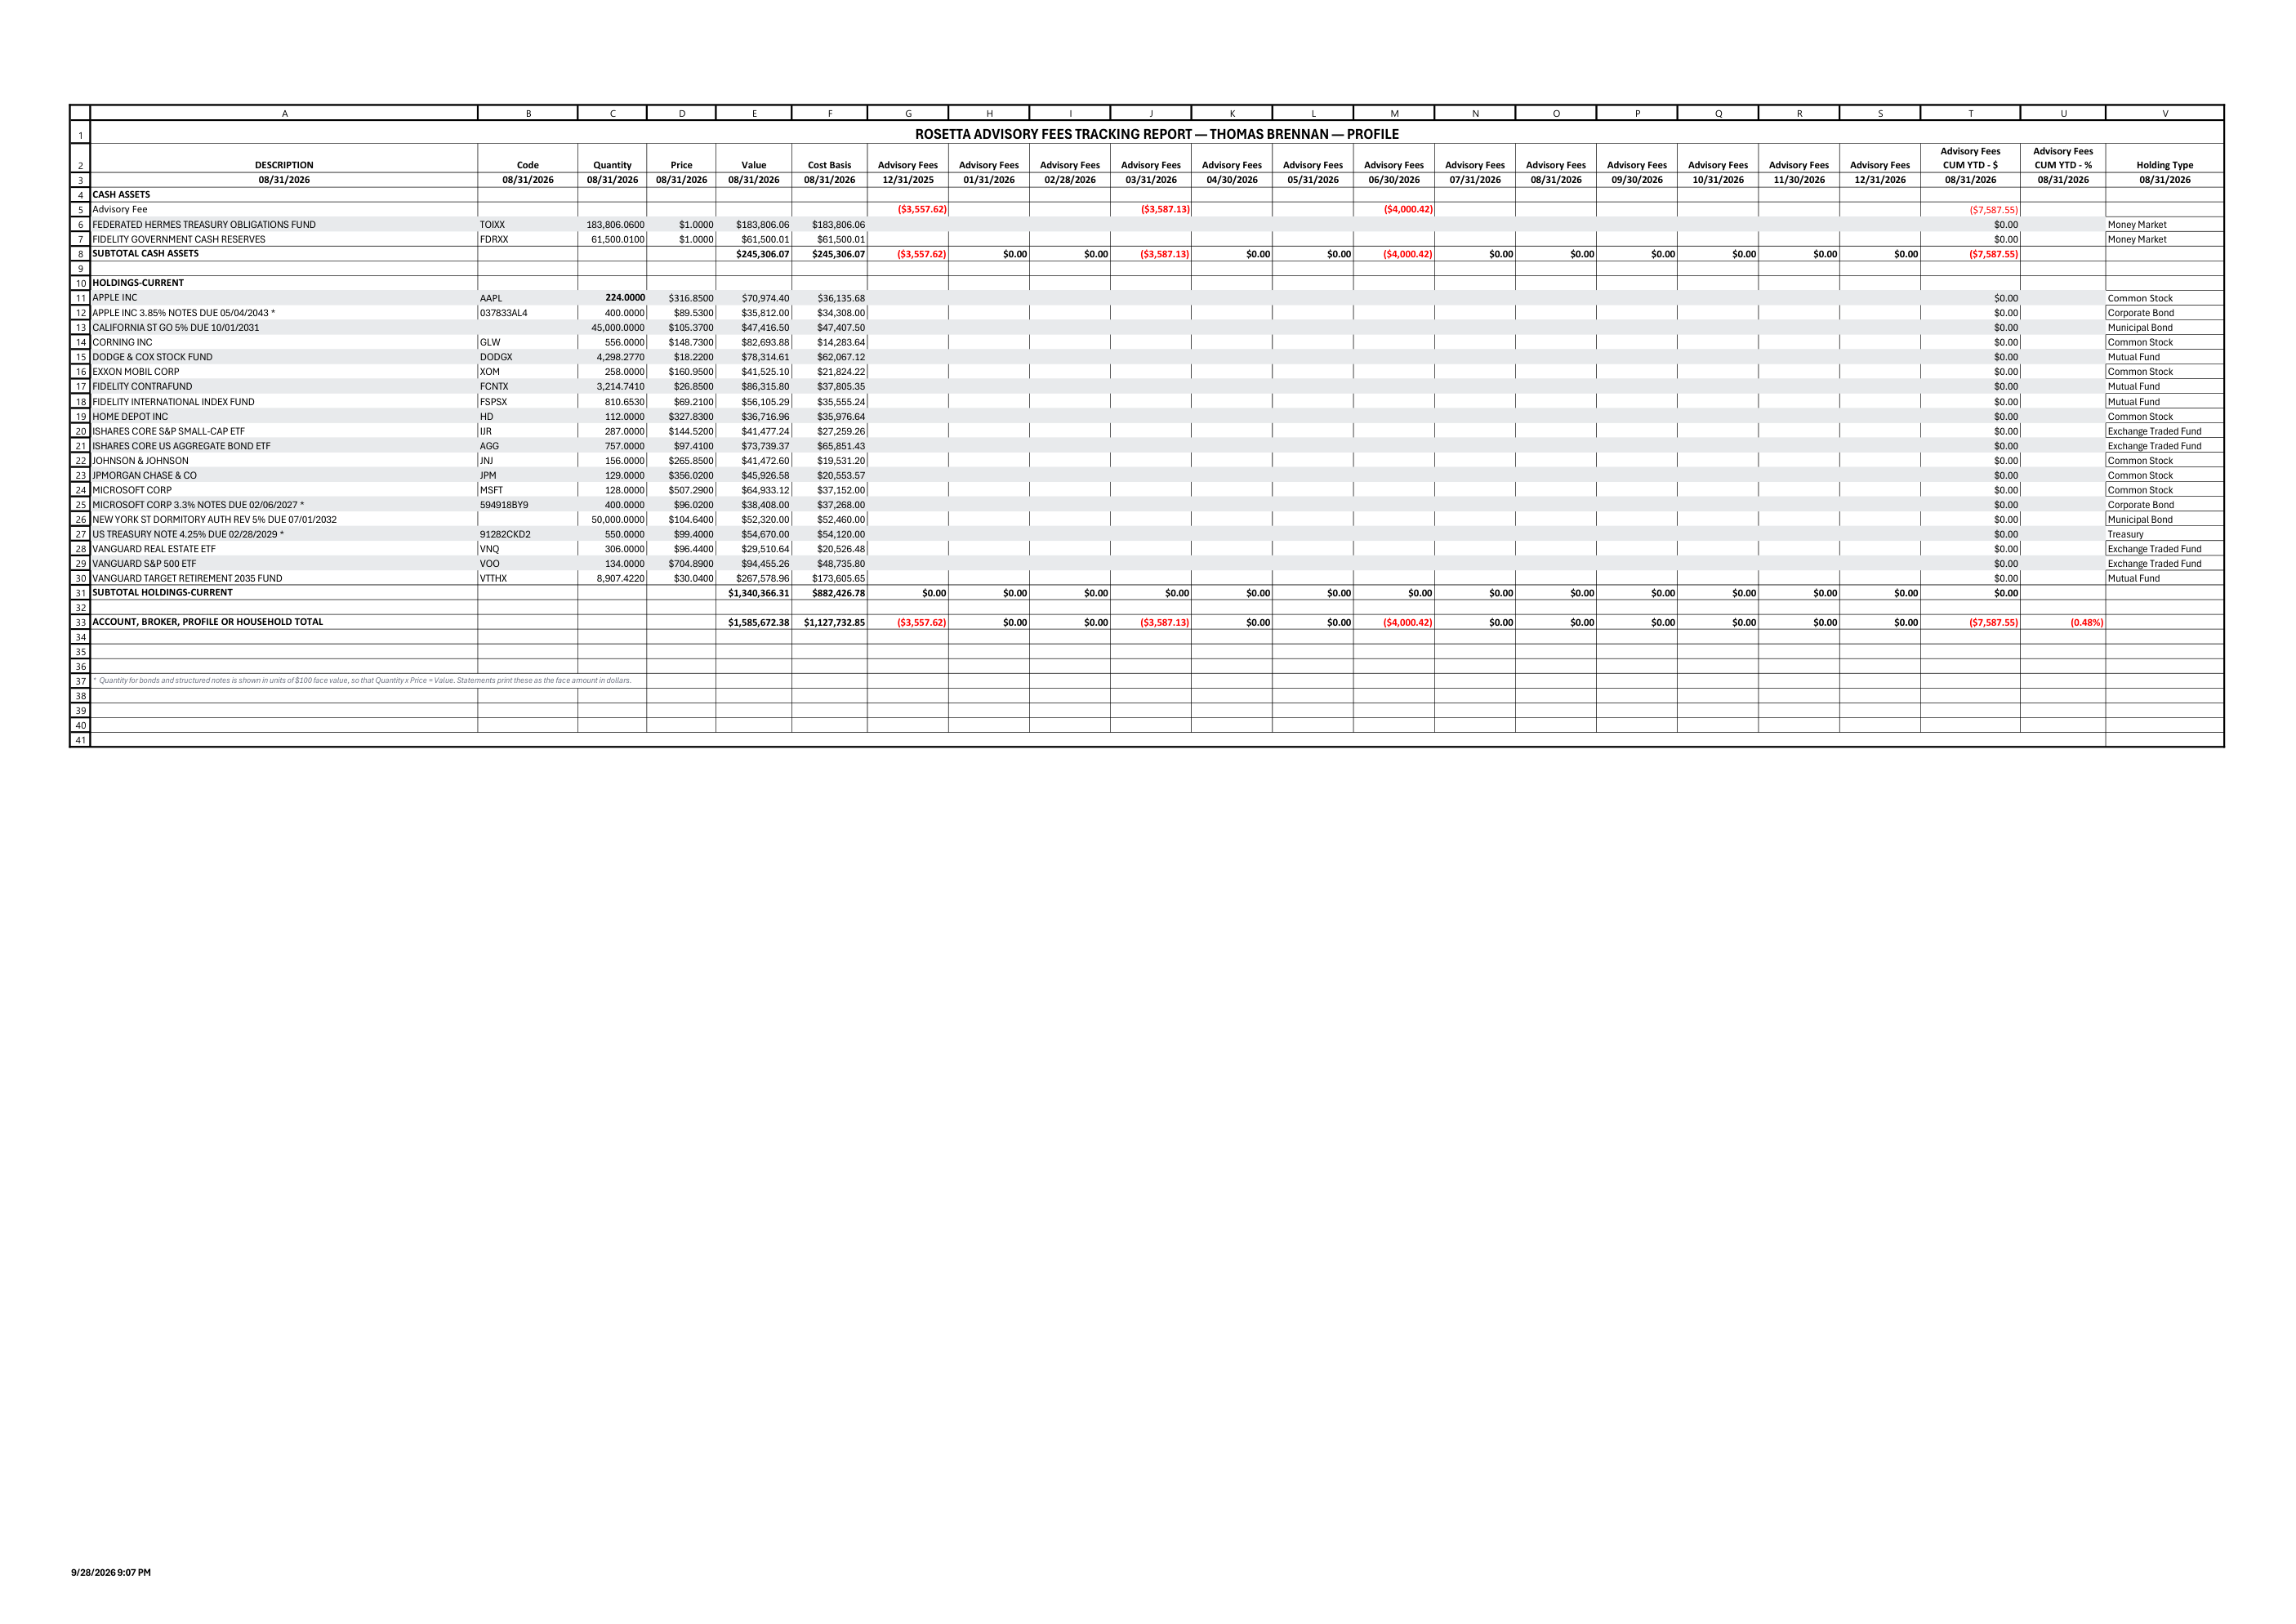 Click to see full size
SAMPLE DATA — NOT A REAL PORTFOLIO
The household report
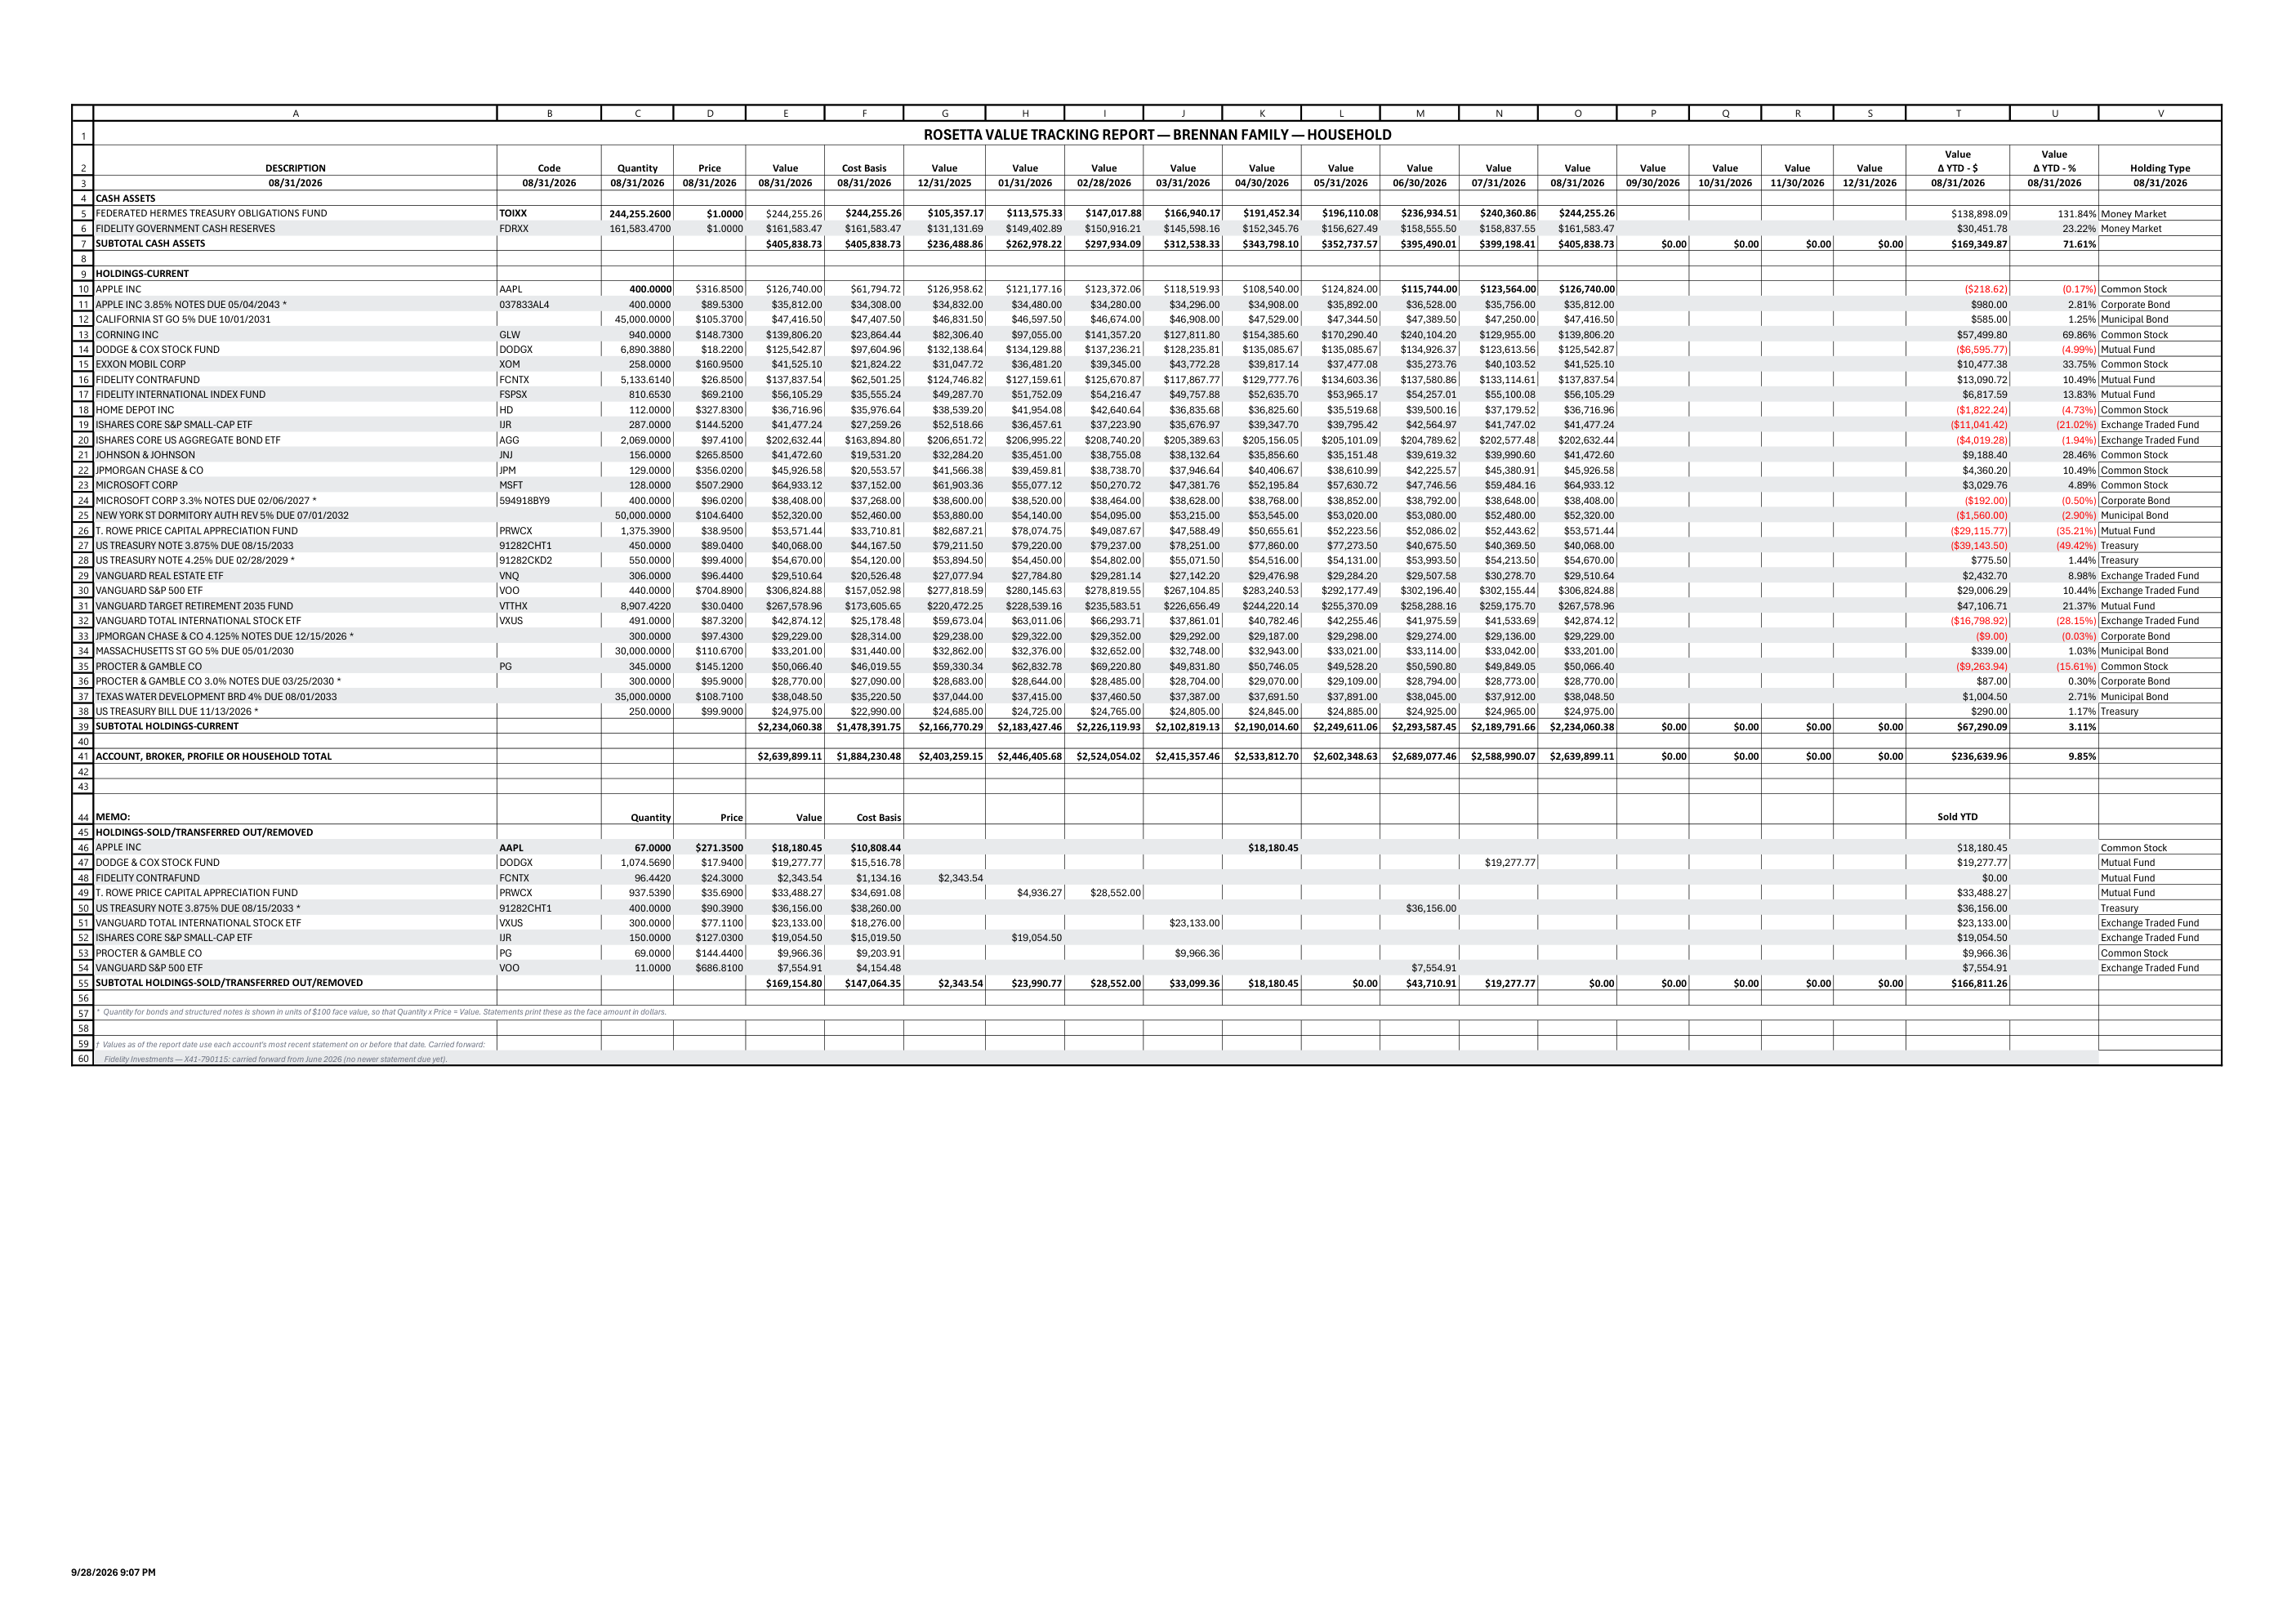 Click to see full size
SAMPLE DATA — NOT A REAL PORTFOLIO
Total Value – Household Level
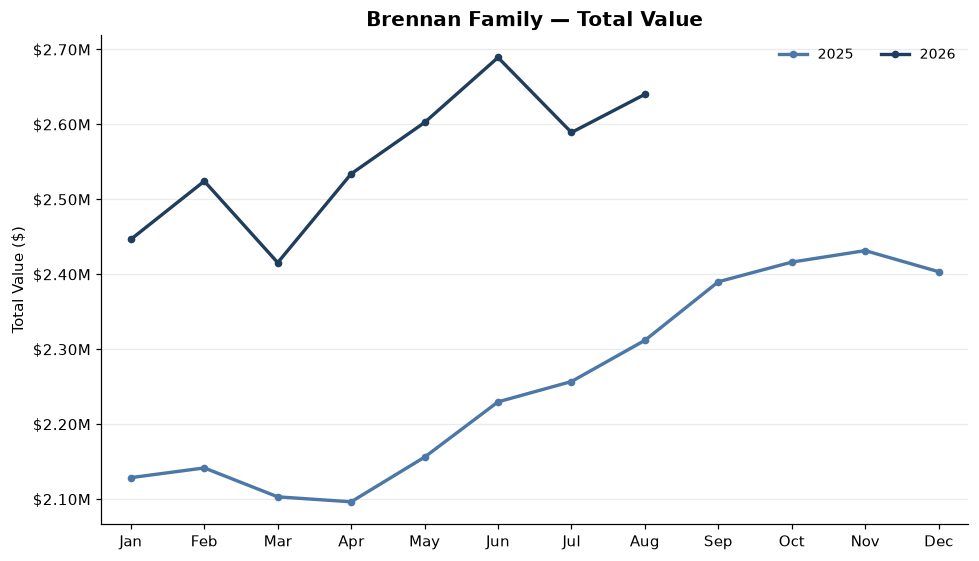 Click to see full size
SAMPLE DATA — NOT A REAL PORTFOLIO
Total Value – Thomas Profile Level
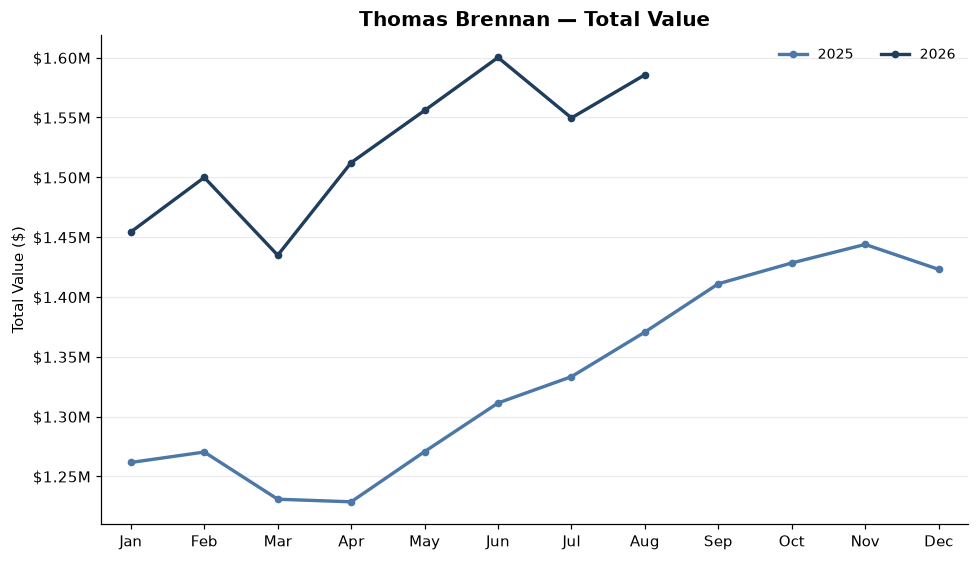 Click to see full size
SAMPLE DATA — NOT A REAL PORTFOLIO
Total Value – Margaret Profile Level
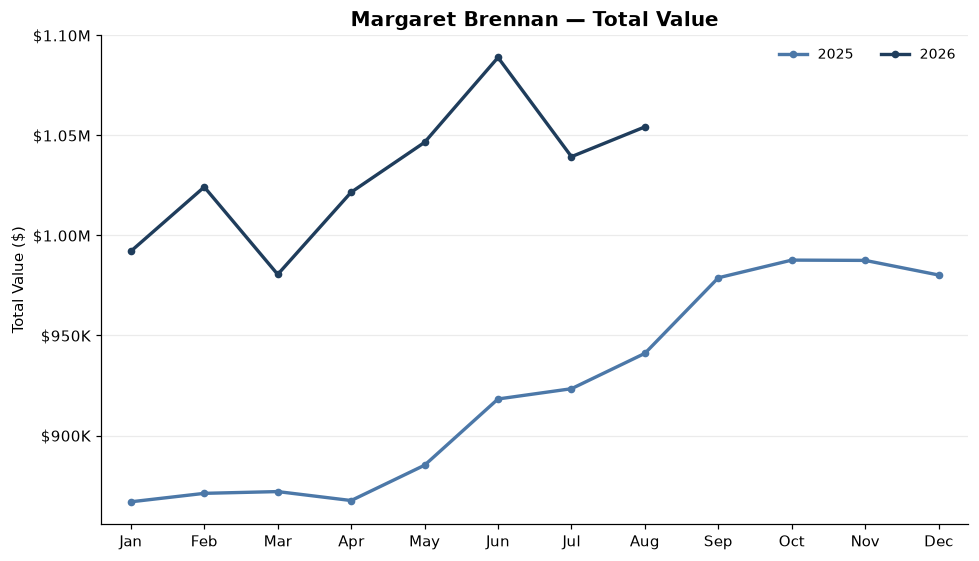 Click to see full size
SAMPLE DATA — NOT A REAL PORTFOLIO
Total Value – Thomas Account Level
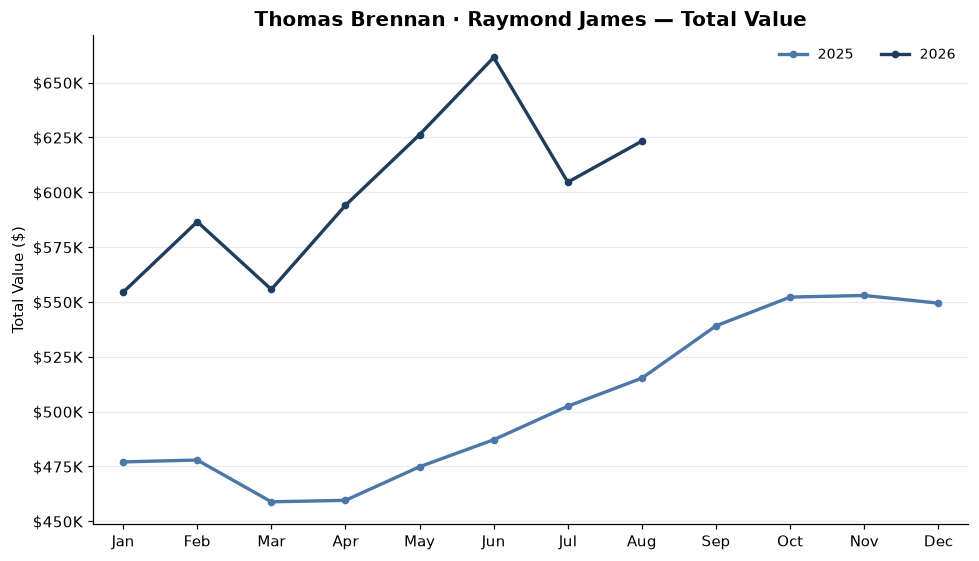 Click to see full size
SAMPLE DATA — NOT A REAL PORTFOLIO
Total Value – Security Level
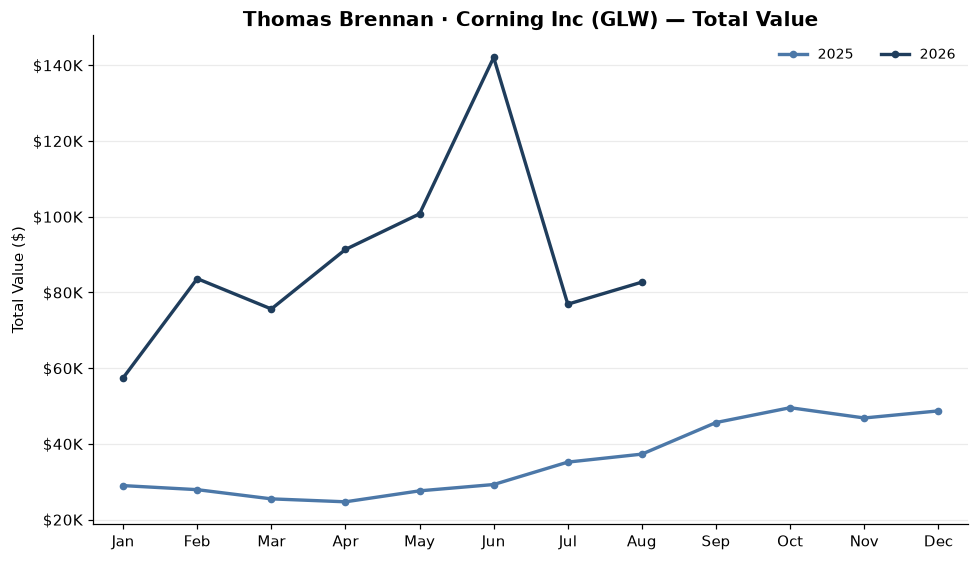 Click to see full size
SAMPLE DATA — NOT A REAL PORTFOLIO
Price Per Share – Security Level
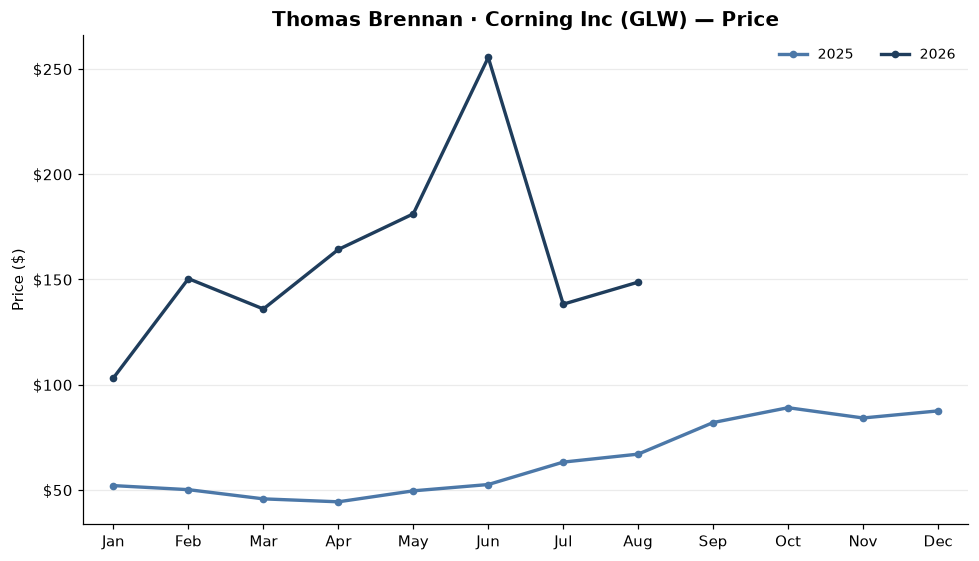 Click to see full size
SAMPLE DATA — NOT A REAL PORTFOLIO
Unrealized Gain/(Loss) – Security Level
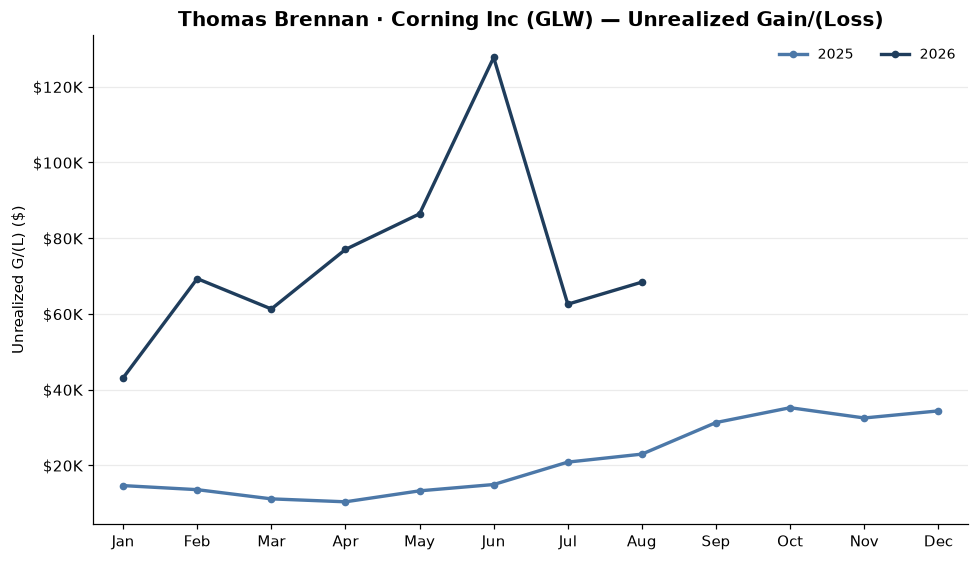 Click to see full size
SAMPLE DATA — NOT A REAL PORTFOLIO
Unrealized Gain/(Loss) – Thomas Profile Level
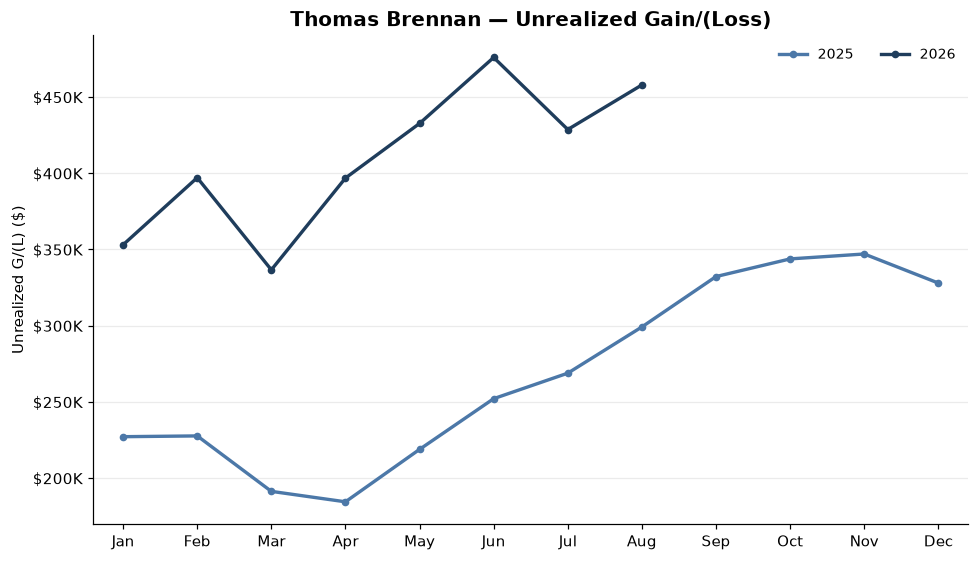 Click to see full size
SAMPLE DATA — NOT A REAL PORTFOLIO
Estimated Annual Income – Thomas Profile Level
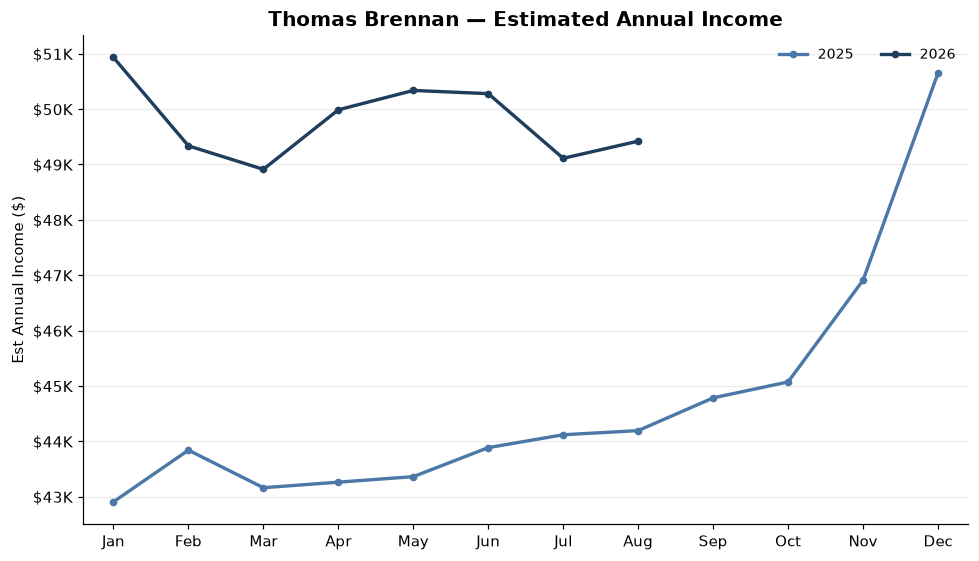 Click to see full size
SAMPLE DATA — NOT A REAL PORTFOLIO
Cash Balances – Thomas Profile Level
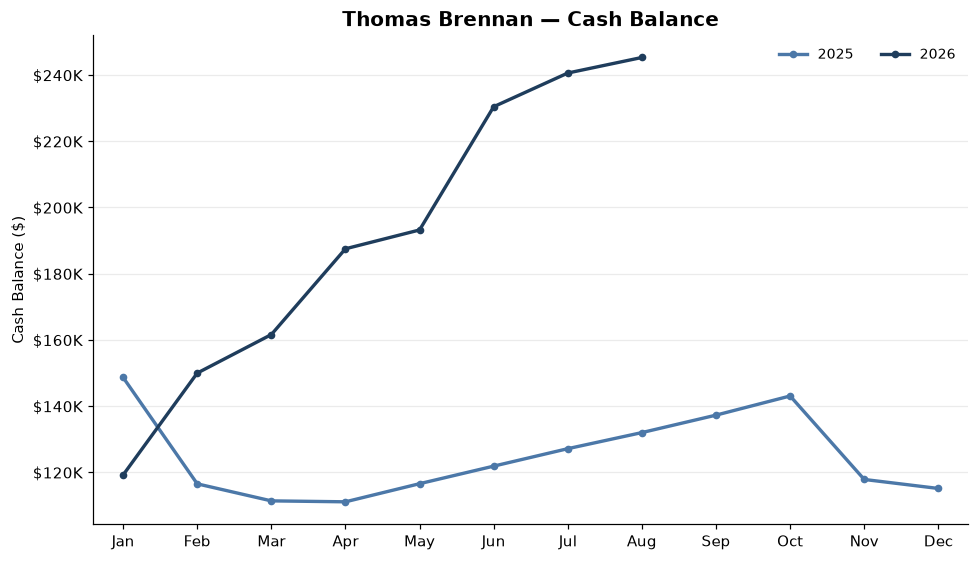 Click to see full size
SAMPLE DATA — NOT A REAL PORTFOLIO
Total Value vs. Market – Thomas Profile Level
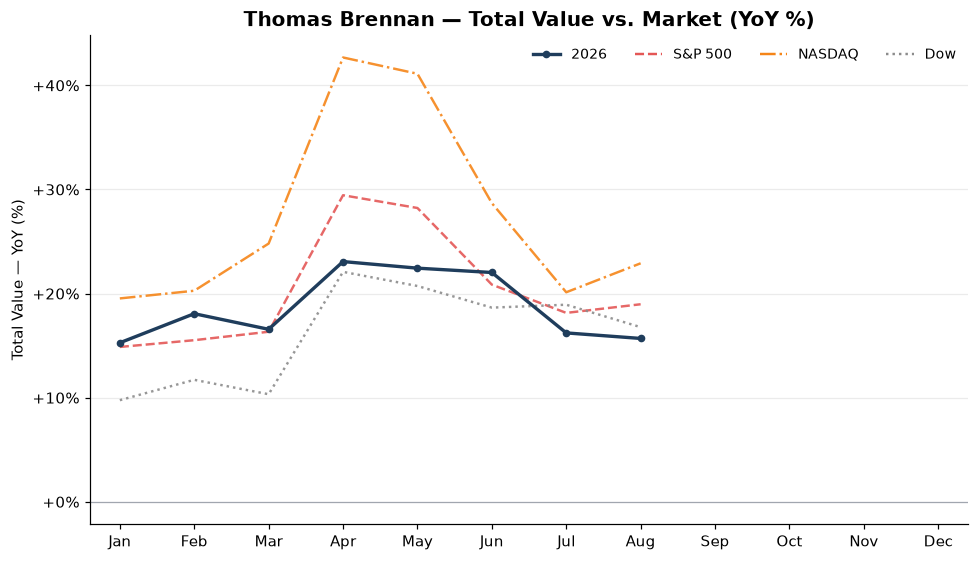 Click to see full size
SAMPLE DATA — NOT A REAL PORTFOLIO
Total Income (Div + Int) YOY % – Thomas Profile Level
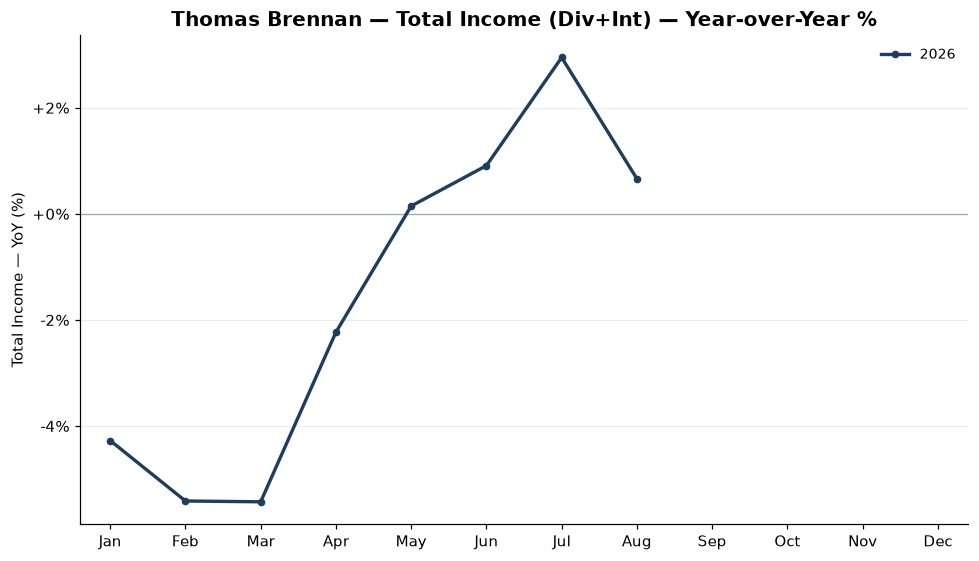 Click to see full size
SAMPLE DATA — NOT A REAL PORTFOLIO